By Michael Swanson, Ph.D., Chief Agricultural Economist, Wells Fargo Agri-Food Institute
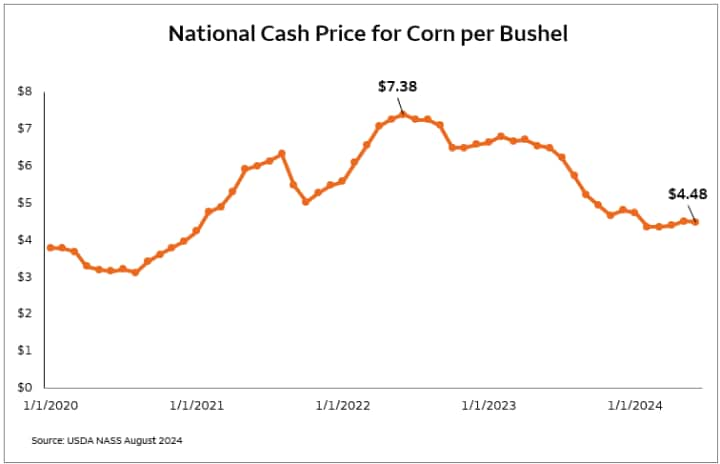
Grain and oilseeds are the most important, and yield the highest revenue, of all U.S. agricultural crops marketed globally. These crops impact every aspect of the food system from the cost of feed to the cost of the inputs to grow them. Since the start of COVID in the spring of 2020, grain and oilseeds have moved through a major price cycle. The main catalyst for the price dynamics was the Russian invasion of Ukraine, creating serious concerns about the supply from these two major exporters. However, ultimately, Ukraine and Russia have continued to supply the market better than the initial expectations. In addition, key exporters like Brazil, Argentina, Canada and Australia took the opportunity to expand acreage and production of these crops.
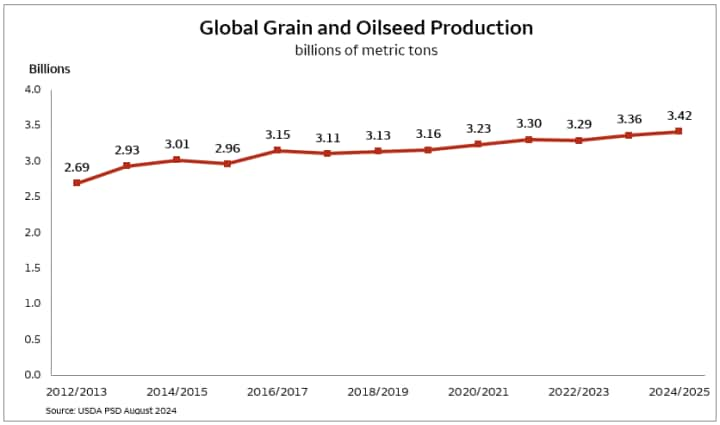
As shown in the chart below, there was a minor decline in the 2022 production of grain and oilseeds, but the 2023 and 2024 crops have been more than adequate to eliminate the supply risk premium.


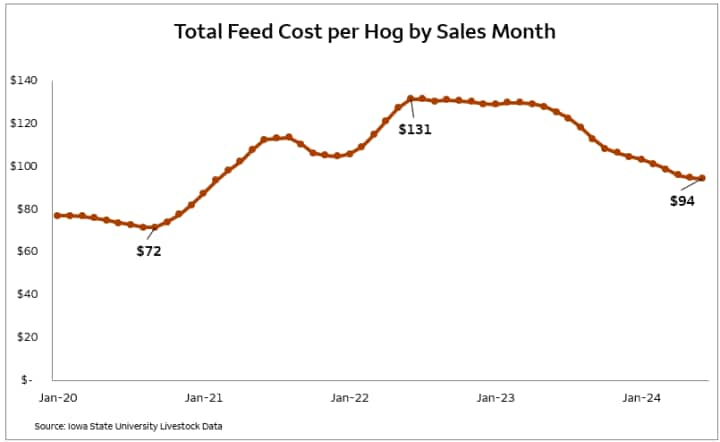
The grain and soybean price cycle, precipitated by the Russia/Ukraine conflict, sent major shockwaves through the U.S. food system. At the same time that labor and transportation costs, resulting from COVID disruptions were also driving prices higher. Using the Iowa State University data, the cost of feeding a hog for sale rose from $72 in September of 2020 to $131 in June of 2022. It has since declined to $94 per head as of June of 2024, and will continue to decline as the lower price of corn and feeds works its way through the system. At its peak price, feed accounted for 66% of the total cost to send a hog to market.4

This same cost dynamic is working through all the proteins with similar impacts. According to the USDA, 77% of the variable cost of milk is feed cost, and feed accounts for 51% of the total cost of milk. While poultry and beef production have different cost shares, feed costs are always the single largest factor in total production.
With the significant drop in feed costs and their direct impact on the cost of production, should the consumer expect price relief at the supermarket and at restaurants? The answer is yes, but they need to expect it to be slow and muted by many complicating competitive factors.
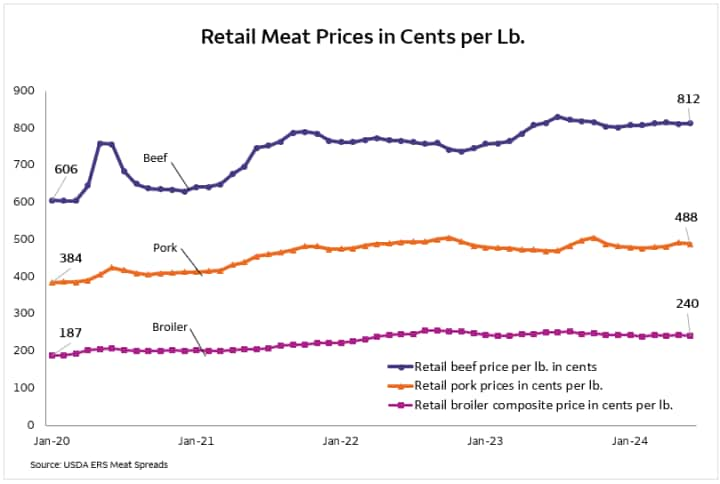
The following chart shows the price for the three major proteins at the retail level beginning in 2020. None of the retail prices moved up immediately, with the exception of beef which also dropped back sharply. Many of the livestock operators and processors suffered compressed margins as they passed along double-digit cost increases with single-digit price increases. The drop in feed costs will lower the cost of production and encourage additional supply competition through improved margins. However, this will not completely offset the increased labor costs that the entire supply chain has built into its structure. The flipside is that wage increases help consumers pay for the higher retail prices which will keep them elevated. No one feels good about the idea of higher wages offsetting price increases, but the strong demand in terms of consumption demonstrates significant impact.

The drop in crop prices will work backwards in the supply chain as well. The University of Minnesota’s Center for Farm Financial Management database calculated the total cost of production for cash rent corn in 2023 at $4.98 per bushel, and total cost of production for soybean at $11.60 per bushel. The recent drop in CME futures prices shows corn at $3.99 per bushel in December, and soybeans at $10.16 for November. With a cash price that is more often below the quoted future’s price, farmers will be losing money on every bushel they sell. Higher yields should help reduce the cost of production, but it will not be enough to offset the large drop in prices. There is not much farmers can do about this year’s cost structure. They agree to cash rents, fertilizer, seed, and equipment costs well in advance of planting the crop, and most of them do little price risk management through hedging. Losses from this year’s crop will eat into their strong financial position from the previous three years, thus reducing financial liquidity.
The USDA’s initial estimate of net farm income released in February, before the drop in crop prices, had anticipated some of the negative development. The USDA Economic Research Service had lowered net farm income in 2023 from $156 billion to $116 billion in 2024. It's most likely that the USDA will lower that number further at the fall release. It might not fall as much as expected since the livestock feeders are still receiving strong prices, and the lower feed costs will help them gain profitability.
Feed purchases account for 48% of total intermediate expenses in the USDA farm and livestock P&L estimates. What about the other 52% of the cost structure? Well, 32% of the intermediate input purchases fall into categories such as seed, fertilizer, crop chemical, and machinery. Without a doubt, these purchases, plus the super important category of cash rent for crop ground will be getting a serious pushback from the farm operators this fall as they try to avoid a repeat of this year’s losses. Landowners and crop input suppliers should be prepared for lots of questions along with price shopping from their customers.
Ultimately, it is always best for everyone to grow a great crop. Higher supply creates more demand as prices drop and additional global consumers can be supplied. Economically, the process of adjustment is always uncertain and painful for the market participants who have the prices moving in the wrong direction for their consumption or profits. The key to managing market changes involves staying informed and making the right decision quickly, no matter how unpleasant. The old quote will remain correct no matter what, “It is not the well adapted that thrive but the highly adaptable.” The farm and agribusiness environment knows this better than almost anyone.
 Michael Swanson, Ph.D. is the Chief Agricultural Economist within Wells Fargo's Agri-Food Institute. He is responsible for analyzing the impact of energy on agriculture and strategic analysis for key agricultural commodities and livestock sectors. His focus includes the systems analysis of consumer food demand and its linkage to agribusiness. Additionally, he helps develop credit and risk strategies for Wells Fargo’s customers, and performs macroeconomic and international analysis on agricultural production and agribusiness.
Michael joined Wells Fargo in 2000 as a senior economist. Prior, he worked for Land O’ Lakes and supervised a portion of the supply chain for dairy products, including scheduling the production, warehousing, and distribution of more than 400 million pounds of cheese annually, and also supervised sales forecasting. Before Land O’Lakes, Michael worked for Cargill’s Colombian subsidiary, Cargill Cafetera de Manizales S.A., with responsibility for grain imports and value-added sales to feed producers and flour millers. Michael started his career as a transportation analyst with Burlington Northern Railway.
Michael received undergraduate degrees in economics and business administration from the University of St. Thomas, and both his master’s and doctorate degrees in agricultural and applied economics from the University of Minnesota.

 Sign On